9.1 Categorical Auto-RQA
The answer is to create a recurrence matrix, or, a recurrence plot. We simply put the time series on both the rows and columns of a matrix and put a black dot (or a 1) in every cell in which the same value occurs, that is, we evaluate every possible combination of time points and note whenever we encounter a value that is recurring.
You can create a recurrence matrix in casnet using the function rp(). Function rp() returns a sparse matrix created with package Matrix which has a lot of attributes attached, including the time series it is based on.
RP <- rp(y1 = bear_up, emLag = 1, emDim = 1, emRad = 0)This is called Auto-Recurrence Quantification Analysis, because we are evaluating the recurrences across all lags of time within 1 time series.
rp_plot(RP, plotDimensions = TRUE, drawDiagonal = TRUE, drawGrid = TRUE, courseGrain = FALSE)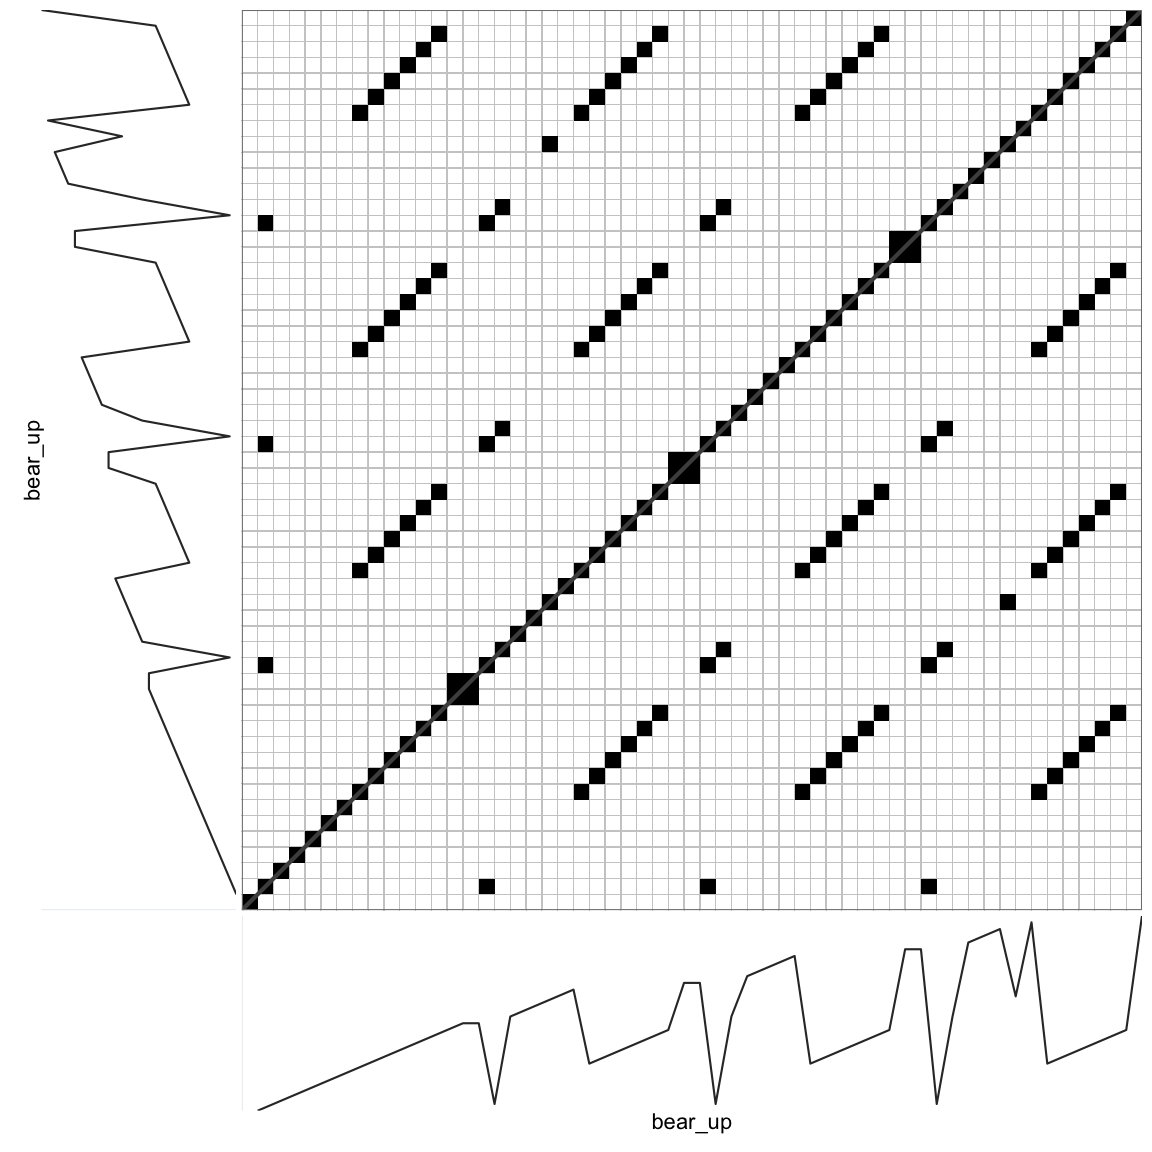
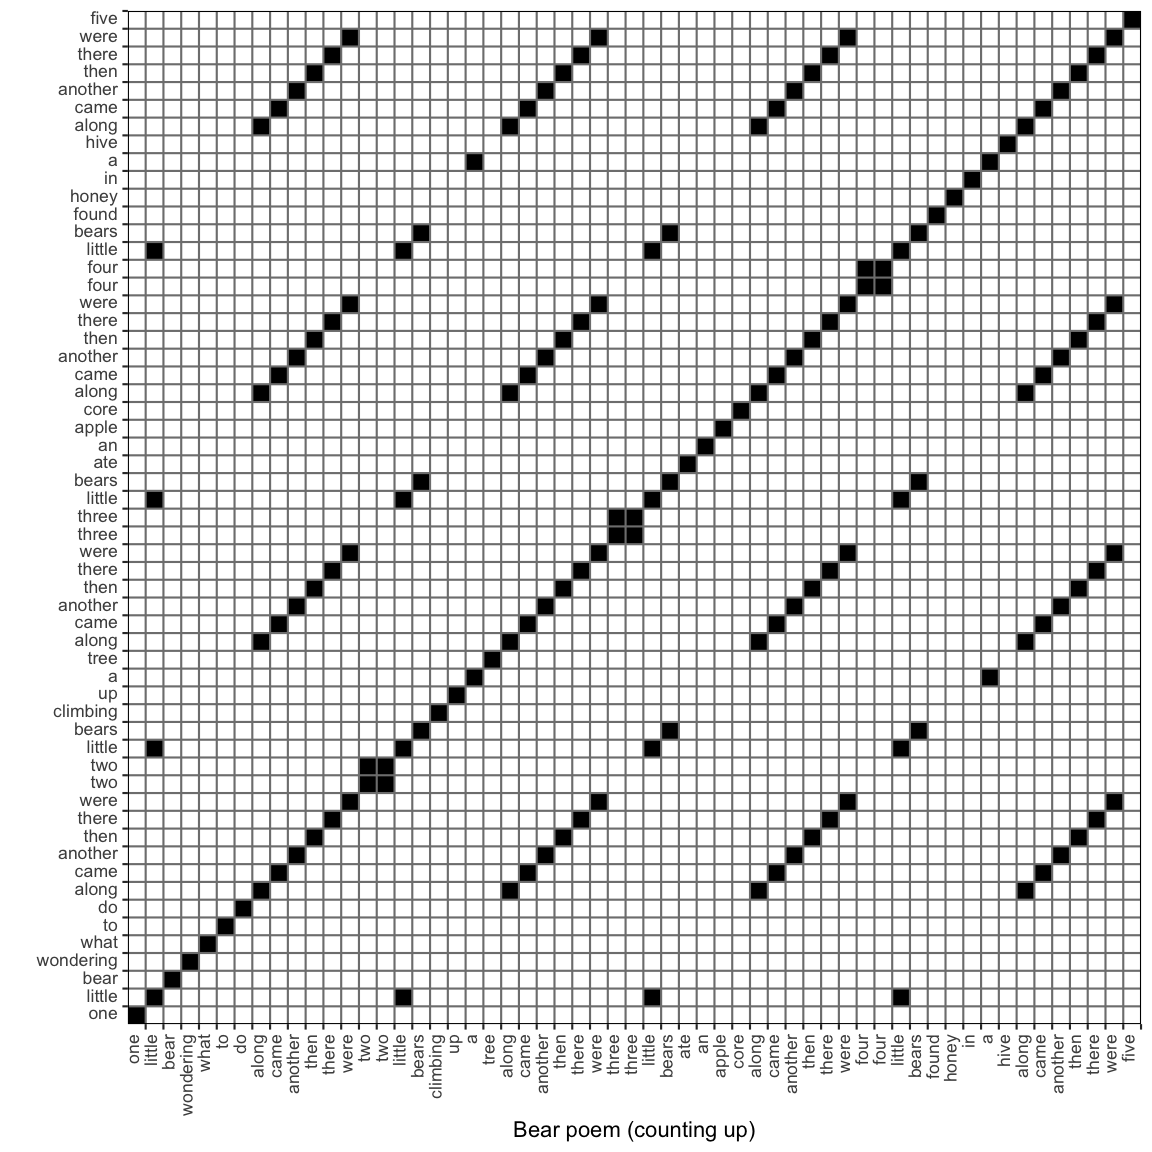
Figure 9.1: Recurrence Plot of the Poem.
The auto-recurrence plot is symmetrical around the diagonal. The diagonal represents the exact coincidence of the time series with itself, it is often called the Line of Incidence (LOI) or Line of Synchronization (LOS).
9.1.1 Auto-RQA Measures
The basic measures that are calculated from the auto-recurrence matrix are based on the number of recurring points and whether the points are on a diagonal or vertical (horizontal) line structure. Often, the diagonal is excluded from the calculations, this can be achieved manually by setting the argument theiler = 0 when creating the recurrence matrix using function rp(). Differences in RQA output between different software packages can often be attributed to inclusion or exclusion of the main diagonal (see the paragraph on the theiler window)
The points that form line structures represent the repetition of dynamic patterns, in the present example, the repetition of certain patterns of words in the text. In the recurrence plot of the poem, mostly diagonal lines can be seen. Diagonal lines represent the repetition of any type of pattern, like "along came another" and "then there were". Horizontal (or vertical) lines represent the repetition of exactly the same value, in the time series of the poem, there is only repetition of the counting words ("two", "three", “four”). These particular repetitions emerge as blocks on the diagonal.
The most frequently used measures calculated from the plot are (see section ):
- The Recurrence Rate (RR) is simply the amount of recurrent points divided over the number of points that could potentially be recurring, i.e. the size of the matrix. This measure corresponds to the correlation sum.
- Determinism (DET) is the proportion of points that fall on a diagonal line.
- Laminarity (LAM) is the proportion of points that fall on a vertical (V Laminarity) or a horizontal line (H Laminarity), or the total (H+V Laminarity)
Several other measures are often reported based on the line structures in the plot:
- Mean line is the mean of line lengths. Commonly used symbols are L for diagonal lines and TT (trapping time) non-diagonal lines, in casnet:
- Diagonal: MEAN_dl
- Horizontal: MEAN_hl
- Vertical: MEAN_vl
- Max. line the maximum of observed line lengths. Commonly used symbols L_max, H_max, V_max, in casnet:
- Diagonal: MAX_dl
- Horizontal: MAX_hl
- Vertical: MAX_vl
- Entropy of the distribution of the line lengths. This is not the entropy of the time series (e.g. Sample Entropy), but the Shannon entropy of the histogram of the line lengths. Commonly used symbols are H, or ENTR, in casnet:
- Diagonal: ENT_dl
- Horizontal: ENT_hl
- Vertical: ENT_vl
To get the basic measures from the recurrence matrix use function rp_measures()
bear_up_out <- rp_measures(RP, silent = FALSE)>
> ~~~o~~o~~casnet~~o~~o~~~
> Global Measures
> Global Max.points N.points RR Singular Divergence Repetitiveness
> 1 Matrix 3192 98 0.0307 14 0.167 0
>
>
> Line-based Measures
> Lines N.lines N.points Measure Rate Mean Max. ENT ENT_rel CoV
> 1 Diagonal 18 84 DET 0.857 4.67 6 0.637 0.157 0.416
> 2 Vertical 1 0 V LAM 0.000 0.00 0 0.000 0.000 NA
> 3 Horizontal 1 0 H LAM 0.000 0.00 0 0.000 0.000 NA
> 4 V+H Total 2 0 V+H LAM 0.000 0.00 0 0.000 0.000 NaN
>
> ~~~o~~o~~casnet~~o~~o~~~The function returns a data frame with all the measures, but can also print a nice summary table. The table is stored in the attribute measureTable of the data frame.
The table output is grouped into Global Measures and Line-based Measures, some properties of the matrix and line distributions are also provided. There are 98 recurring points in the matrix (excluding the diagonal). Divide this on the size of the matrix (excluding the diagonal) 57 * 56 = 3192, gives a recurrence rate of 3.07%. The Singular Points measure indicates there are 14 recurrent points that are not on any line. A measure that is reported in the data frame, but not in the table is the Singularity Rate, which is calculated as the number of singular points on the total number of recurrent points, in the present case 14.3% of recurring points are not part of any larger pattern.
The global measure Divergence is calculated as the multiplicative inverse of the maximum diagonal line length (1/6 = 0.17), which is thought to be an estimate of the (trend of the) positive maximal Lyapunov Exponent. This exponent represents the rate of separation between two trajectories in the phase space of a dynamical system with almost identical initial conditions. How fast such trajectories will diverge is an indication of a system’s sensitivity to initial conditions. The largest recurring dynamic pattern represents the maximal stability of the deterministic structure of the system and due to the definition of Divergence in RQA, the maximum diagonal line line length could be considered an estimate of the Lyapunov time. However, the relation between Lyapunov exponents and RQA measures is quite complicated and should be interpreted with care. Of course, in the context of a poem about bears, this measure may be difficult to interpret.
The global measure Repetitiveness is calculated as (N points on horizontal lines + N points on vertical lines) / N points on diagonal lines. This is the proportion of recurrent points that form line structures that are repetitions of the same value.
There are 18 diagonal lines, made up of a total of 84 recurrent points. The output shows the mean and max line lengths, the entropy of the distribution of line lengths, the relative entropy (standardised on the time series length) and the coefficient of variation of the line lengths. The Laminarity is split between Horizontal and Vertical lines, but also the ‘global’ Laminarity, based on both Horizontal and Vertical lines is reported.
9.1.2 The theiler window
As discussed above, there are no horizontal or vertical lines in the Recurrence Plot of this poem because, by default, the diagonal is removed from the calculations in Auto-RQA. If we include the diagonal there should be horizontal and vertical lines of length 2, representing the repetition of the counting words. This can be achieved by setting the argument theiler = 0.
RP2 <- rp(y1 = bear_up, emLag = 1, emDim = 1, emRad = 0, theiler = 0)

bear_up_out2 <- rp_measures(RP2, silent = FALSE)
>
> ~~~o~~o~~casnet~~o~~o~~~
> Global Measures
> Global Max.points N.points RR Singular Divergence Repetitiveness
> 1 Matrix 3249 155 0.0477 14 0.0175 0.17
>
>
> Line-based Measures
> Lines N.lines N.points Measure Rate Mean Max. ENT ENT_rel CoV
> 1 Diagonal 19 141 DET 0.9097 7.42 57 0.809 0.2 1.64
> 2 Vertical 6 12 V LAM 0.0774 2.00 2 0.000 0.0 0.00
> 3 Horizontal 6 12 H LAM 0.0774 2.00 2 0.000 0.0 0.00
> 4 V+H Total 12 24 V+H LAM 0.0774 2.00 2 0.000 0.0 0.00
>
> ~~~o~~o~~casnet~~o~~o~~~There are now 6 vertical and horizontal lines of length 2, they make up the ‘cubes’ visible on the main diagonal. Obviously, including the diagonal in the calculations will change the values of measures. In addition to measures based on Horizontal and Vertical line structures, the size of the RP will now be 57 * 57 = 3249 instead of 57 * 56 = 3192. The number of recurrent points also changes (by 57), which affects the recurrence rate: 4.77%. It is therefore important to always report whether or not the diagonal is included in calculations of Auto-RQA measures.
The theiler argument represents the number (or range) of diagonals that will be removed, or rather, ‘cleared’ before recurrence measures are calculated. This can be thought of as a kind of filter for signals of which it is know they are autocorrelated on relatively short time scales. The idea is that these autocorrelations (which will pop up as recurrent points around the main diagonal) are less interesting to consider than long-range dependencies.
Important: In casnet the value passed to the theiler window argument will affect all measures, whereas in other RQA software, you can notice that only the global measures and those based on diagonal lines are affected. That is, in the example above, with theiler = 1, other RQA software will report the same values for Horizontal and Vertical measures as casnet does with theiler = 0. In our opinion it is more consistent to consider line structures of length 2, of which one point lies on the main diagonal, as a single recurrence, because in Auto-RQA:
- The main diagonal is simply the Line of Incidence, the
lag-0auto-correlation, which is always1.
- If a value observed at time
tis repeated at timet+1, this is a single repetition of the value, the lag-0 autocorrelation should not be included. - If a value observed at time
tis repeated at timet+1and att+2there are 2 recurrences of the value observed attand this should be considered a line of length2.
In Cross-RQA, 2 different time series are evaluated. The lag-0 auto-correlation is not represented, but rather, the lag-0 cross-correlation. This does have a meaningful interpretation, because it represents the recurrence of values in 2 different time series at exactly the same time, which is why it is called the Line of Synchronisation. Therefore, in Cross-RQA the main diagonal should in most cases not be excluded and theiler = 0 should be used. If theiler = NA, the function will decide the best setting based on the symmetry of recurrence matrix, if it is symmetrical,the context is Auto-RQA and the diagonal will be excluded (theiler = 1). If it is not symmetrical the context is Cross-RQA and the main diagonal will be included (theiler = 0).