B.1 Plotting a ts object as a time series
Depending on which packages you use, there will be different settings applied to time series objects created by ts(). Below are some examples of differences between plotting routines.
require(lattice)       # Needed for plotting
require(latticeExtra)  # Needed for plotting
require(casnet)        # Need for ts_center()

# stats::plot.ts
plot(Y, lwd = 2, main = "stats::plot.ts")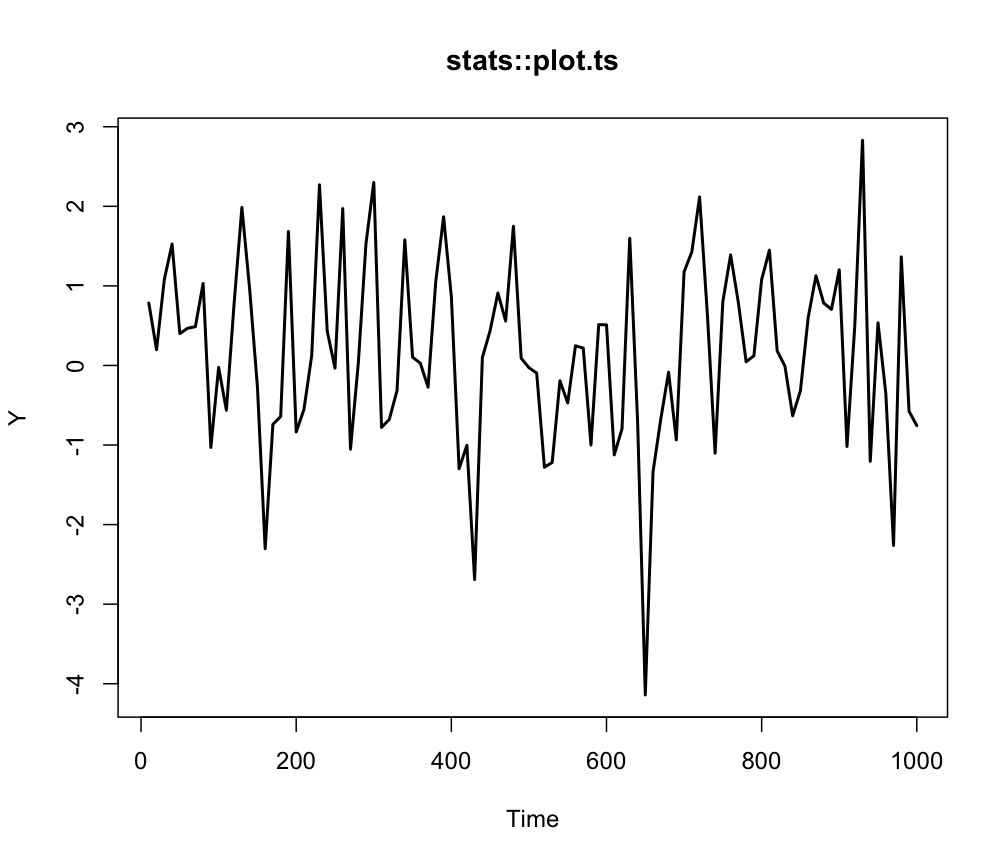
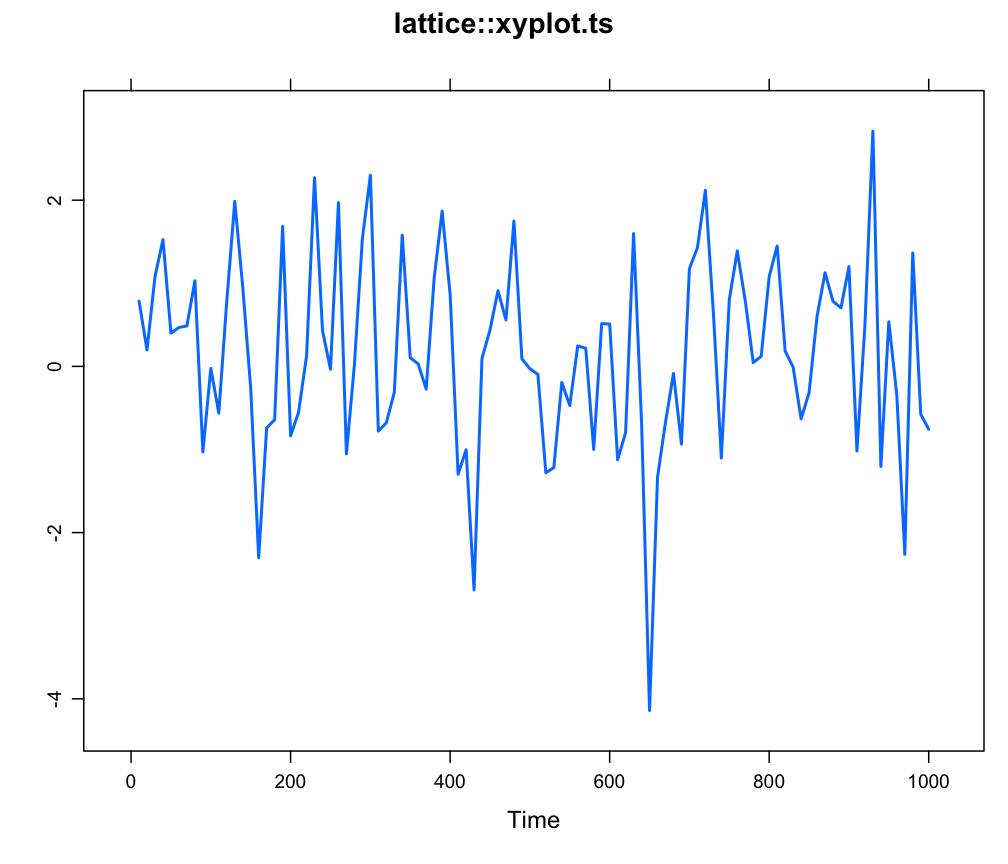
# lattice::xyplot.ts
xyplot(Y, lwd = 2, main = "lattice::xyplot.ts")